
At Figaf we have created a tool to make it effortless to perform regression tests of SAP Cloud Integration/CPI. Yet when we talk to customers about the need for testing they often mention they need to perform performance testing of SAP Cloud Integration.
As a developer, you want to be able to check if your platform can handle 100.000 messages an hour on both the Cloud Integration or the backend systems. The only way is to send many messages to the platform.
At Figaf, we do a lot with Regression Testing SAP Cloud Integration to ensure that the payloads always create a consistent result and to validate the CPI system to ensure it does not change after each upgrade. Since April 2019, we have had tasks in our backlog to create a performance testing tool for SAP Cloud Integration, but we did not know how to build it and what to do. The big challenge is: What it is you want to measure and how to perform it and how do we add value to the process?
Watch on YouTube Performance testing SAP Cloud integration with JMeter
NOTE: Please note, before scaling the number of messages up, you have to inform relevant partners of it and check the license requirements of the APIs used.
Apache JMeter
Apache JMeter is probably the largest Open Source tool to handle performance testing. They have figured out how to scale a testing tool to send large volumes of data and not care about anything other than getting an HTTP Status 200 back.
I decided to look at the options to see what is possible for running different IFlows several times so that you can simulate a specific load. It is pretty impressive of what is possible with the setup in a short period. I’m not an expert in the field, but if you want huge volumes of testing you probably should consider a Jmeter expert. You can find the Jmx file at the end of the blog.
Sample test plan
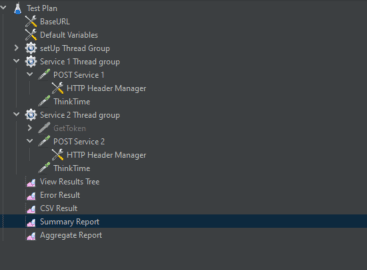
Configuration
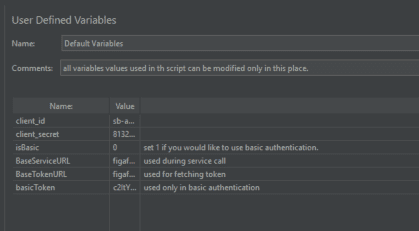
There is a configuration setup on the default tap, where you can set up information for your SAP Cloud Integration system and how you want to authenticate. Either use Basic authentication or switch to Oauth authentication. So it can be used for both Neo and Cloud Foundry. You may need to fill in the basicToken your self, you can get this from postman.
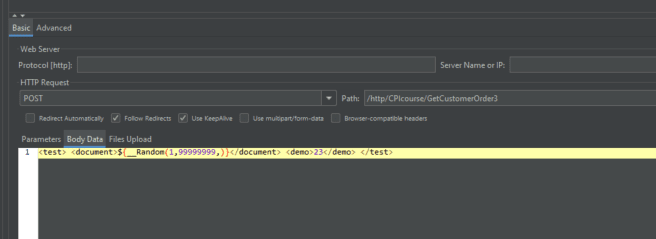
In Post Service 1, you can add the path of the IFlow, host is configured in the Default Variable. The payload can be inserted in the body, and you can use ${__Random(1,99999999,)} if you want to generate some random order numbers.
Running
If you just want to run a few clients/users concurrently, you can run it using the GUI and your local PC. I tried with 500 concurrent connections, and it did not affect my PC. But I think too much of the CPI load balancer on our partner system. If you need to scale to 10.000s users, then you could consider running from a cloud server.
Reporting
So how many requests can the system perform? That is the answer you want to receive from this. There are many different ways you can gain data about the processing time. There is a summary report like the following to show how many requests you are sending and their status.
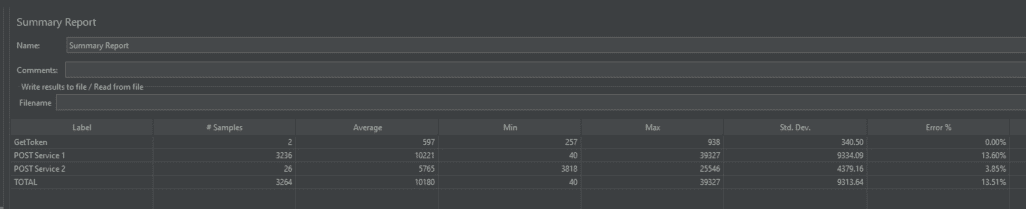
You can also generate a report like the following:
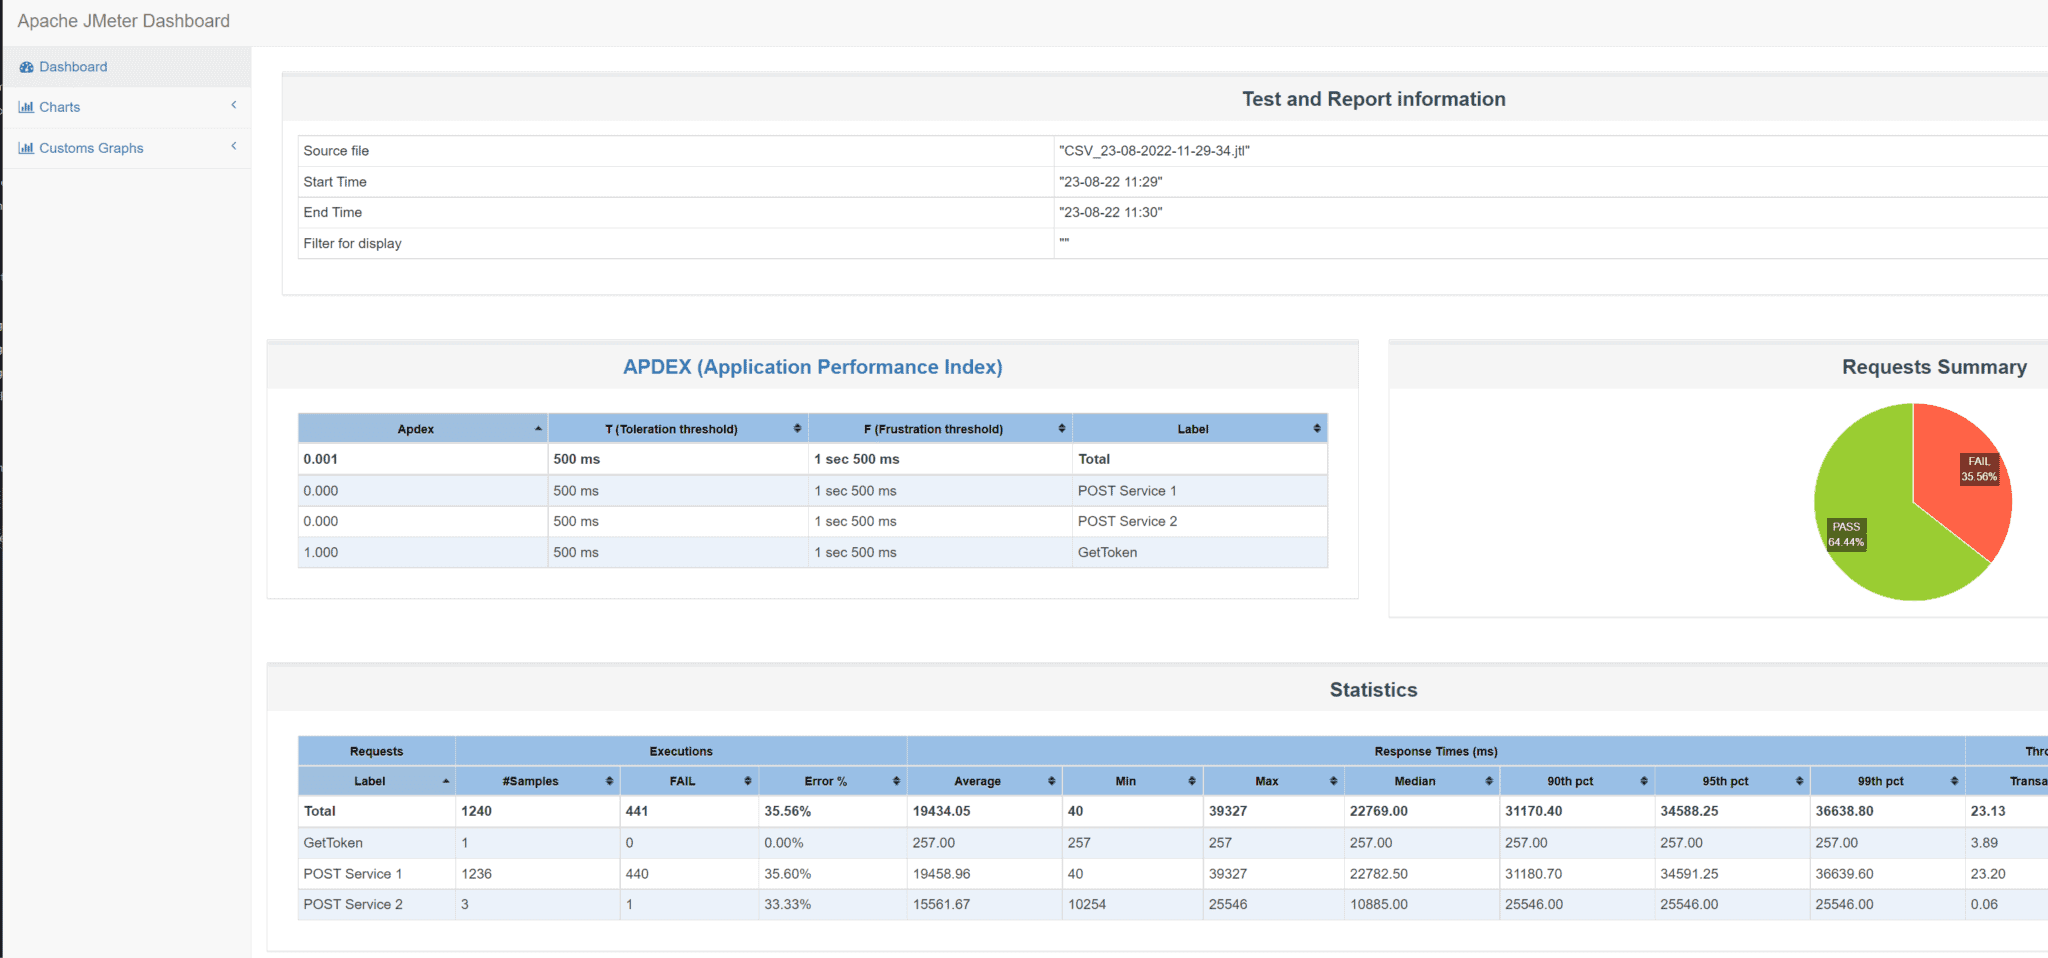
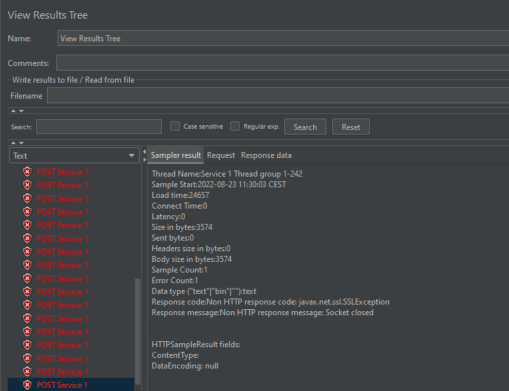
Or drill into the errors received. This is probably the CPI load balancer giving some problems on my partner system with 500 concurrent requests.
Get the sample file
You can download the sample file here. After download, unzip the file.
Start up JMeter and load the JMX file there.
Integration with Figaf
When we do deliver tooling, we are considering how we can include it in the Figaf DevOps Suite to make it easier to manage. We did consider that you could generate the JMX file for the scenario. But the only thing we would need to add was just a simple payload. So it was easier to let you have the file and make your modifications yourself.
If it becomes relevant later, we will try to add something similar to the Figaf DevOps Suite. Only if we see that we can add value to the process. At Figaf we are more about performing regression tests to check if the IFlows create the expected result.