
The way we are testing SAP CPI is to use the trace functionality. Then we don’t need to perform any modification to the iflow to enable testing. It does mean you have to wait until somebody has been processing some messages on an interface.
Normally SAP CPI only allows trace to be active for 10 minutes and the payloads are persisted for about 60 minutes.
Update: There has been an update to CPI Helper that enables you to keep an iflow in trace mode for a longer time if you are using the browser plugin for an iflow.
The challenge with it is that it requests the user to know when a message is processed. For a test system, you can trigger a message when you want for a productive system, the message may only be processed once a day.
We strive to make it as easy as possible for user to create test cases, even for productive systems.
So normally if you decide to record a message in Figaf, then Figaf will switch the iflow into trace mode. This works okay if you know the message is processed within the next 10 minutes. But if you don’t know when it will be processed you are out of luck.
We have therefore added a new feature that will allow you to keep the iflow into trace mode.
How it works

- On the Agent Configuration, you can select how many hours you want to keep iflows in trace mode
- You select the Iflow you want to record messages from and how many messages
- Start a recording and Figaf DevOps then switches the iflow into trace mode
- A batch job runs every 5 minutes to see if there has been collected enough test data for the iflow. If not it switches iflow back into trace mode.
- Another job will download the messages so you can persist them in Figaf.
- Once the duration has passed or the number of messages has been processed correctly, you can find the data in the Figaf Tool
The resulting downloaded information looks like the following.
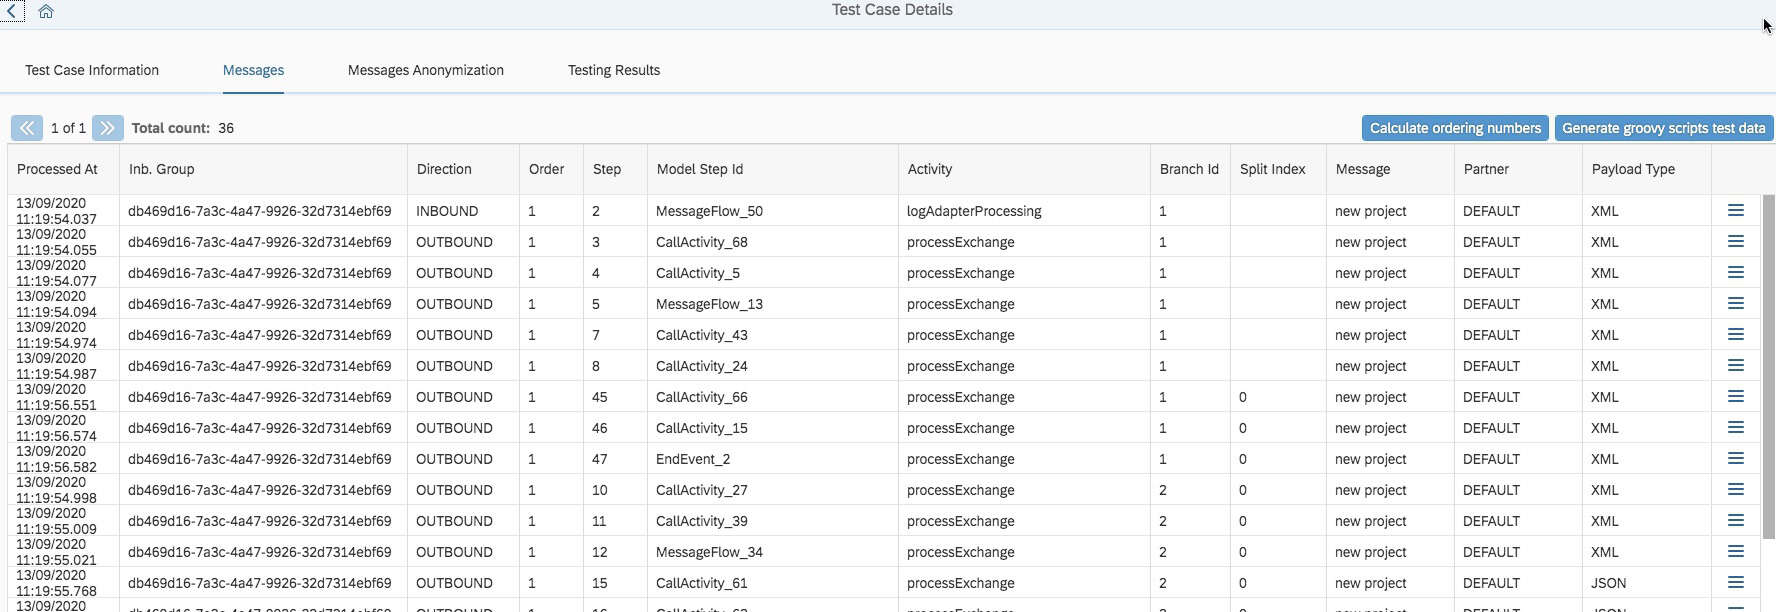
Word of caution. If you start tracing many messages, on high volume interfaces there may be a limit to what can be saved. Only use the function to record a limited number of messages. We don’t know if there are any limits on how much tracing data you can have and if there is any limits on it.
And we currently does not have a way to show how the trace data for a longer duration.
Other uses
Besides using the data for test creation you can also use the data for troubleshooting the processes that run seldom and have some strange behavior.
In Figaf DevOps Suite, you can see all messages processed that have been processed.
Try it yourself
We have a free trial of Figaf DevOps Suite: start your trial.
It takes 10 minutes to start up the application.