One challenge about making an application that runs well is to be able to monitor it with less effort. And being proactive about errors.
SAP CPI comes with some limited screens for monitoring what is processed and active alerting. In your iflows you can set Sender, Receiver and Application id as written here.
Video walkthrough of the process of monitoring your SAP CPI installations
SAP is providing the OData API, so you can make your own monitoring application if you want more than the standard monitor. You can develop the monitor by a number of ways from Analytics Cloud to an SAP UI5 application. They will all work but it is some work you will need to do. You can also use Solman, though I’m not sure it will give much other information. There is also some more advanced monitoring tools from SAP Focused Run and a cloud version, but they will probably require a large investment and implementation.
That is why we have added it as part of the Figaf IRT application. It gives you three essential views:
- Active alerting if a message is not being processed correctly, then it will allow you to set up rules. A rule could be to notify a specific person or to restart the message. For the restart to work, you will need to include a script that saves payload as an attachment in case of errors.
- Monitoring for processes. The Figaf Monitor allows users to set up a group of iFlows to be viewed together. You can then give access to Finance interface for the Finance people, and they will not be able to see anything from HR. The view also gives a better overview of Sender, Receiver, Application ID from the Table view. This will allow you to find the correct message faster. It now also allows you to view both MPL Attachments and Persisted messages
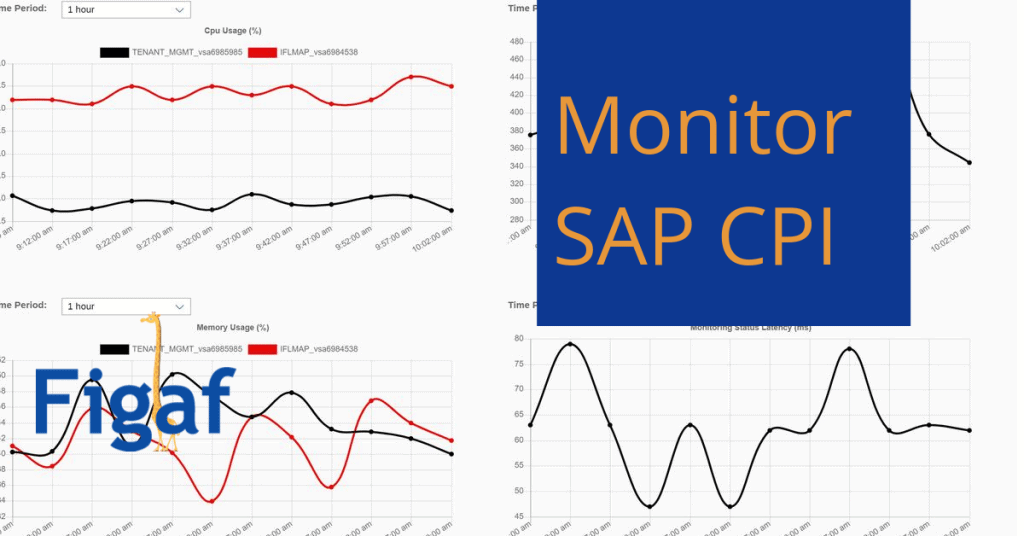
- System status page. We have a page that logs the status of the CPI system every 5 minutes. You then get a nice graph over how the system performs. It also has actions os if latency is above 500ms you can send an email.
Here is a list of screenshots to show that it is possible to monitor SAP CPI better without needing to code anything.
I have recorded a video of this you can see it here.
If you want to try it out you can get started for just 200 EUR/month for our cloud version of Figaf Tool. You can try it out for free.
Extract document information
There are a few fields/meta data that you have to fill in payloads to. They are a must to keep for you to be able to search the payload and understand what has been processed. There are a number of different values you that you can use to extract payloads from.
This section comes from my CPI course blog.
For using it
Message Id
This is a unique name for each subprocess that is called. It seems like it is generated automatically. So a search for this will always return one process. It seems like it is not possible to set this, and probably not something you want.
Correlation Id
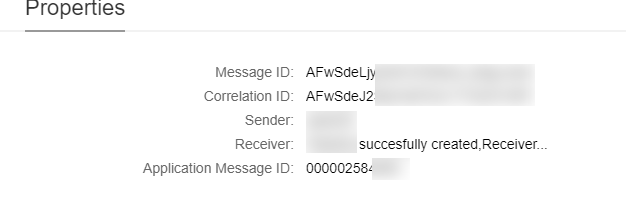
The correlation id is a bit more interesting to monitor processes. In this example, we have a process that spans two CPI processes using the process direct adapter. When we search for the Correlation ID we can see both processes that it is used for.
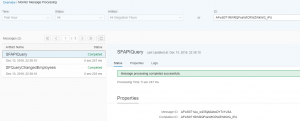
It would make sense to be able to set this correlation id to be the PI message ID, that way it is a lot easier to find which CPI process was started by which PI message. So you can just search on the PI Message GUID.
We simply just need to set the header SAP_MplCorrelationId in the HTTP call to the SAP PI message ID, and then we can search for the value in our CPI system.
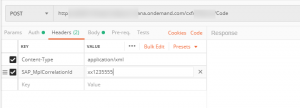
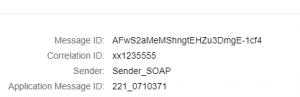
As we can see on this message we set the payload, this time just using postman, but there are different ways to set the header in PI. Then we can see the same correlation ID in the CPI and search for the value. I can send the same message multiple times with the same correlation id it will just be added to the list.
In my scenario, I’m using the SOAP adapter and here XHeader1 value that get the name SAP_MplCorrelationId and then I set the dynamic property to that value.
Application Message ID
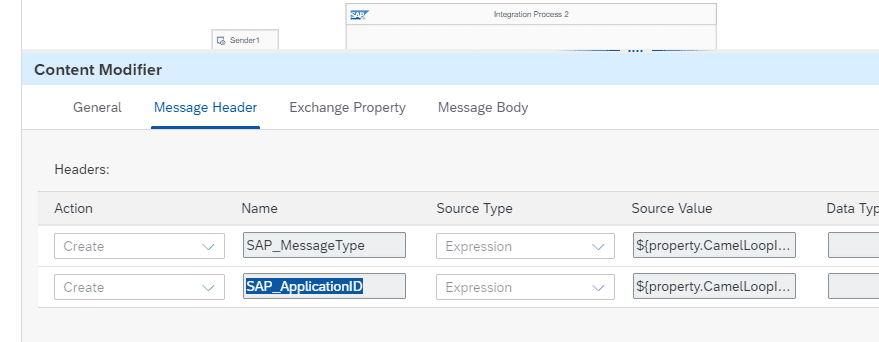
This is where you can put the content of your payload. So you can put in your invoice number. In my case, I want to set them as part of the payload that I can get with some Xpaths and an expression. You just need to send the header value for SAP_ApplicationID and you are able to search for the value
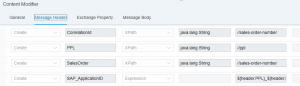
It is unfortunately not possible to search for part of the name or using % or *, but maybe that will change someday.
SAP_MessageType/Application Message Type
You can use the header SAP_MessageType to report some extra data like for instance status code.
Sender and Reciever names
One of the cool things about this is that I also get to learn something. So, Marco Verhoef, that I did a podcast about their implementation on CPI had some extra way to log information. It is also possible to use the sender and receiver to save extra information on the processing. That way you can specify what was done with the message, so it is possible to see where the message was sent.
To do this in runtime you need to delete the sender/receivers and then create them assign values to them.
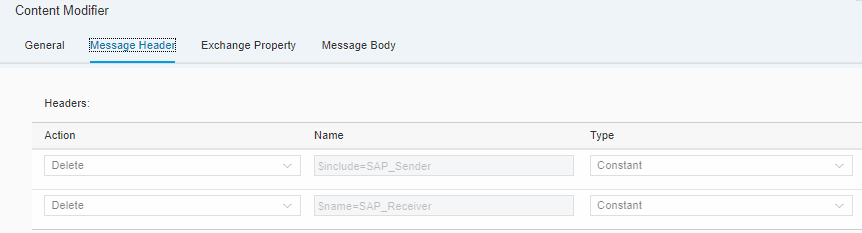
You can also set them in as an HTTP header in your calls SAP_Sender, that will also overwrite the configured values.
The Sender and Receiver is only search able via the Odata API or by using a third party tool like Figaf Alerting Tool.
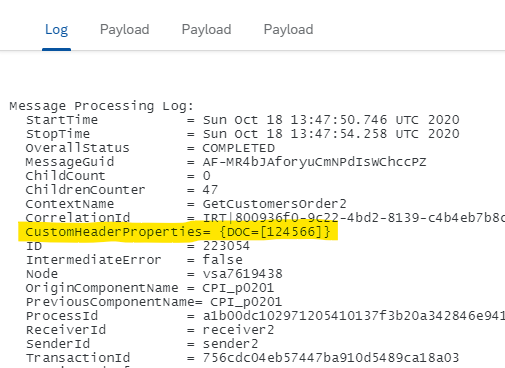
Custom header attributes
One new feature that has been added is the ability to use Custom Header Attribute to save information in. It can be customer number, order number or some other value if you already have used Application_ID.
You can either use the Xpath in a Content Modifier to extract Partner Number or what you need or your can use the parsing in the XML document.
def Message processData(Message message) {
    def body = message.getBody(java.lang.String) as String;

    def messageLog = messageLogFactory.getMessageLog(message);
    def CustomerID = message.getProperty("CustomerID")
    if(messageLog != null){
        messageLog.addCustomHeaderProperty("Customer", CustomerID);
    }

   return message;
}
In the monitor you are able to see this payload in the Text log. But it is not really user friendly.
There is an API that allow you to search for Customer and then the Customer number. It is also in the blog above. It is not documented in SAP API hub at the moment. So it is uncelear what this has of performance impact. The API only allow you to search for a Property Name and Value. It is not possible to apply other filtering on it at.
You can use the SuperEasy plugin for searching for payloads. It is a free Chrome plugin that make some monitoring easier. That plug does support wildcards.
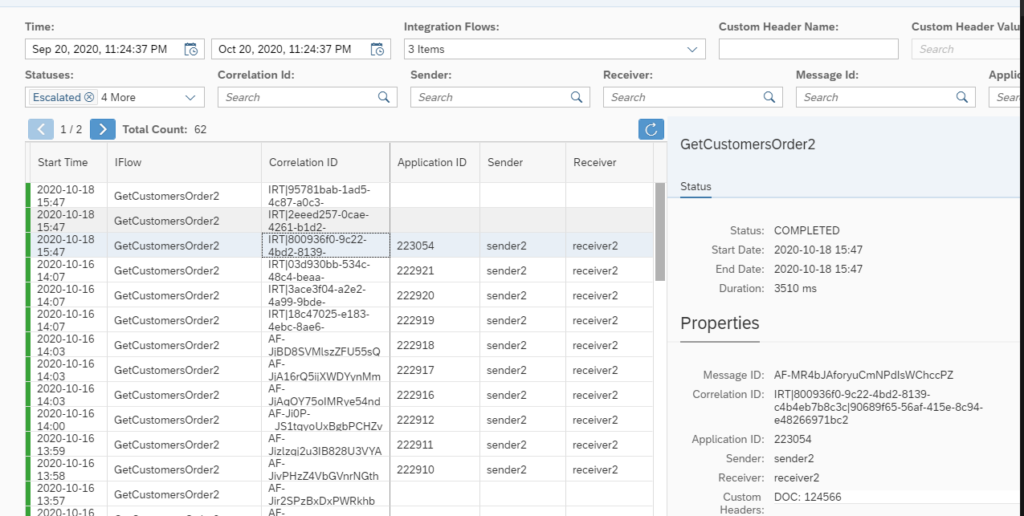
Overview
We want to make it as easy as possible to monitor your SAP CPI. That is why we have improved our message monitor so you are able to see all content in just one view. There is a table for the message runtime. And then there is an option to save view all metadata about a specific process in the right plane.
SAP CPI system performance
Many of the customers I talk with start to see the SAP Cloud Platform Integration(CPI) as a critical tool for their integration needs. In that perspective, it makes sense to be proactive and monitor how it performances.
There are two pages that you can use to check the status reported by SAP as I write about on my blog it is the pages Cloud Status and Status page. They may be relevant to monitor both to warn about what is happening in your landscape.
But what about how to monitor you own tenant and how it is performing. That is the question that most people want to answer because it is what matters for them and then sooner they know about an issue they can setup manual processing or figure out how to do something else. It also provides a way to to messuare if SAP is living up to the SLA of CPI.
How you can messure your CPI tennant
You can setup logging in a number of different tool that will give you some indication of how the system is responding. You can also use the Figaf Alerting Tool that now will allow you to monitor your CPI system. It is pretty simple and does not require any coding form your side.
You can argue if it makes sense to monitor the Memory and CPU usage of a cloud system. And this is not on the Cloud Foundry/Integration Suite system
You will have a dashboard that looks like the following to see the performance of your system. You can see on the diagram that the system is down for maintenance for a period of time over the weekend. It is possible to see we cannot access the management and runtime engine for a period of time. This is a partner tenant so there may be a different performance and number of nodes as a real system. The system also calls an integration flow every 5 minutes to measure how the runtime is perfroming. This is then returning a response, but from time to time it takes almost 2 second to perform. Also, notice that during the maintenance period we still get a response in the range 400 ms. If it is possible to call process messages even when there is a maintenance window it is pretty cool.
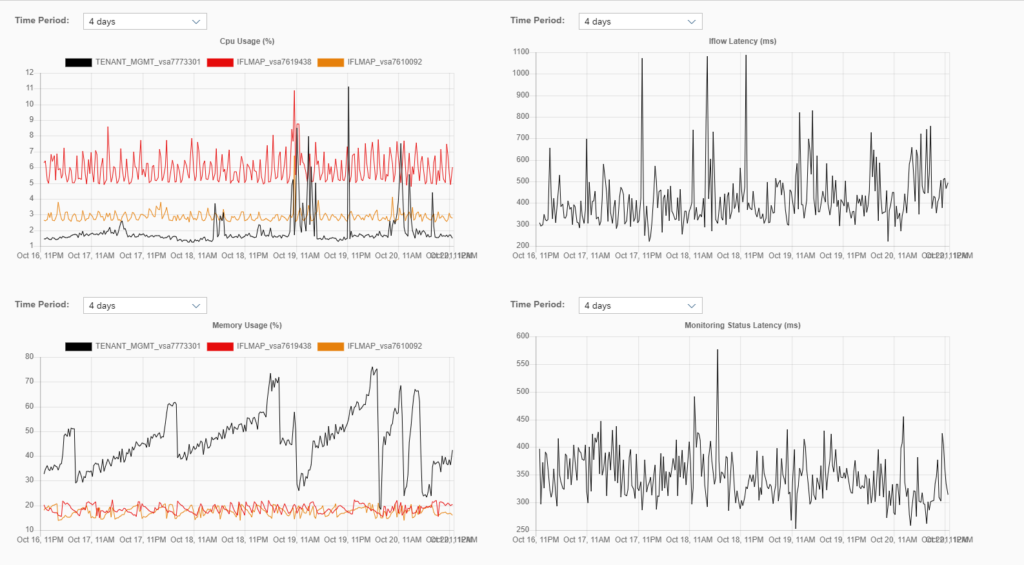

The CPU and Memory “API” is only on NEO not on Cloud Foundry. And it does not matter as much. Since it run in cloud it can scale. You would expect SAP to handle this. It is interesting to see the Latencey. This tells something about how the system is currently performing. If you see some spikes in it there is something to wory about.
Current view of the SAP CPI monitoring
We are now collecting all the metrics for this. Next is that we will be setting up alerts on this with our alert engine. Then you can get a notification if you are getting latencies above, i.e. 2 seconds or the CPU load is above 80%. Or create a Jira ticket with the simple webhook. We will also be adding status of your JMS queue and other relevant metrics asked for by users.
Try the Figaf Alerting Tool
The Figaf Alerting Tool is a part of the Figaf DevOps Suite. So it is one system you buy and then you can use it differently depending on the license you buy.
Sign up for a trial of the Figaf DevOps Suite. It will take you 10 minutes to get started