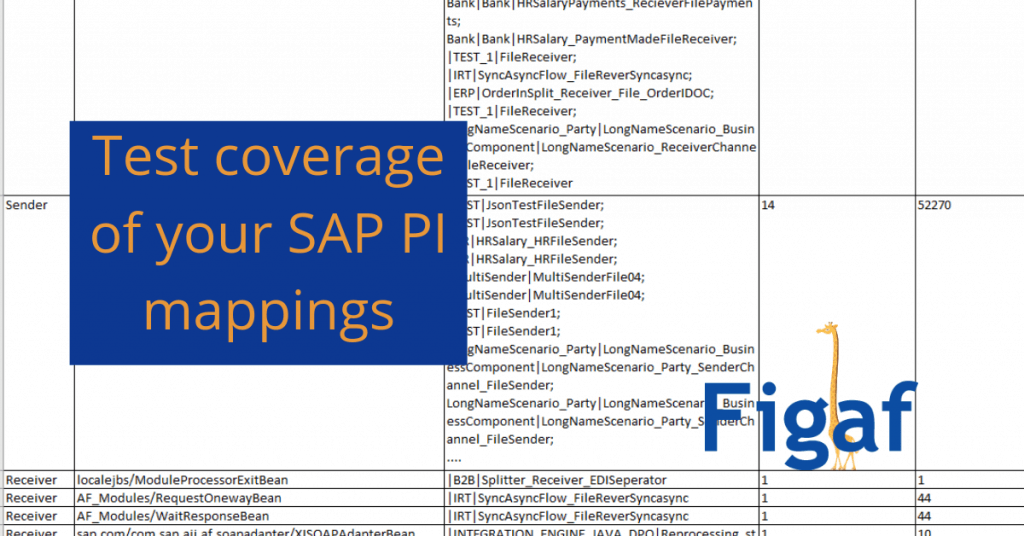
On a customer demo I got asked what is the test coverage of the tool. We do show in the UI how many ICO’s you have test for but how about message mappings and also modules used in your landscape and how many times they was run.
We already build a report that showed how many times a message mapping was run in a given period based on the data in the PI monitor. So it was just about combining the two sources to give users a good view of what is going on.
For each integration flow we added the number of test cases created with the IRT tool. Then number if then propaged down to each message mapping so we can show how many message mappings is tested and more important which is not.
We also added a tab with the modules used in your landscape and how they performed. Probably we also need to add the IRT test cases to this. But it also depend on how people want to with our with our our modules.
Check out the demo and then try it for free on your own system
You can try it out on your own system. Just download the Figaf IRT tool run it on your laptop and you will be able to see the data after the landscape have been downloaded.
[av_button label=’Try IRT FREE’ link=’manually,/irt’ link_target=” size=’x-large’ position=’center’ icon_select=’yes’ icon=’ue82d’ font=’entypo-fontello’ color=’theme-color’ custom_bg=’#444444′ custom_font=’#ffffff’ admin_preview_bg=” av_uid=’av-2xzvbo’]

